| |
|
| |
|
|
|
|
| |
|
| |
|
|
|
|
| |
|
| |
|
|
|
 |
 |
|
IMAGES
ON FUNNEL FLOW
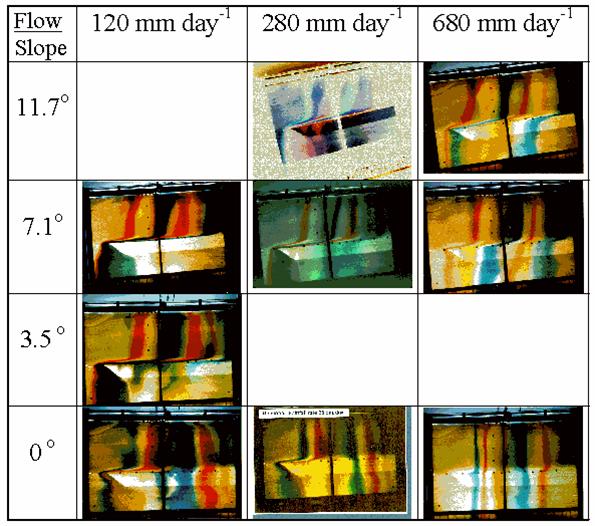
Figure 1. Photographs
of experimental runs with dye tracers. The experiments were performed
in a glass chamber 180 cm long, 110 cm high, and 1 cm thick, baklit
with high-intensity fluorescent light to help visualize the streamlines
and the distribution of moisture content. The chamber was filled with
fine and coarse sand.These
photographs display that the coarse sand layer, which appears white
in the photographs, sloping downhill from the right to left, except
for the three horizontal cases (sloped at 0o). (Source:
Walter et al., 2000)
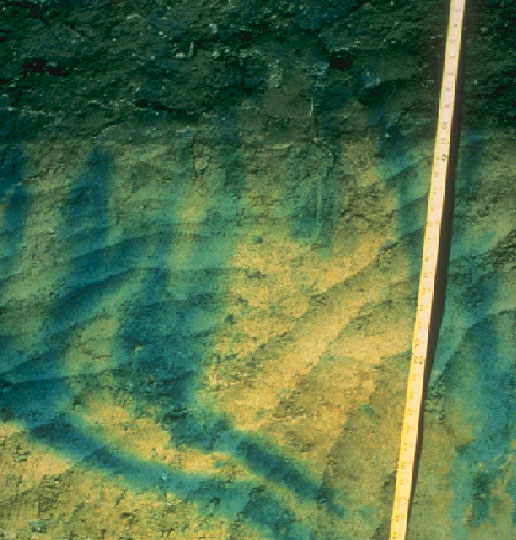
Figure 2. Finger funnel flow
(Source: Soil and Water Lab, Cornell University)
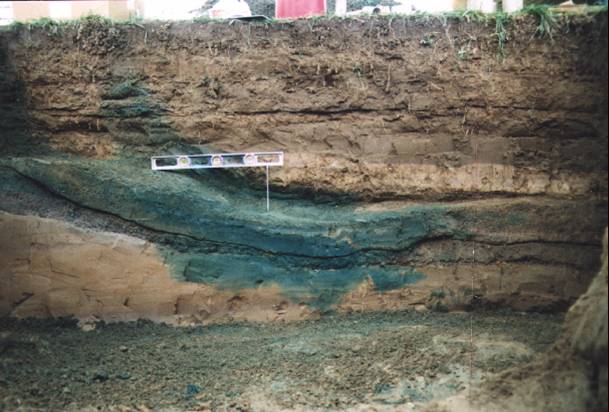
Figure 3a.
Funnel flow at field site. Initially blue dye (FD &C blue dye #1)
was placed near the soil surface and the field was irrigated weekly
(7.5 mm/h for 12-13 hours) for several weeks, the the site was excavated
to examine water and chemical distributions throughout the soil profile.
This figure shows the dye distribution after 22 cm of water application.
Blue dye flowing vertically (unsaturated flow) moves laterally when
it encounters a sloping coarse-texture lens. (Source: Soil and Water
Lab, Cornell University)
Figure 3b.
This figure shows the dye distribution after 75 cm of water application.
Additional dye penetrating into the coarse sand (from Fig 3a) appears
to have moved freely and directly into the fine sand below. (Source:
Soil and Water Lab, Cornell University)
|
||||||||||||||||||||||