| |
|
| |
|
|
|
|
| |
|
| |
|
|
|
|
| |
|
| |
|
|
|
 |
 |
|
IMAGES
ON MACROPORE FLOW
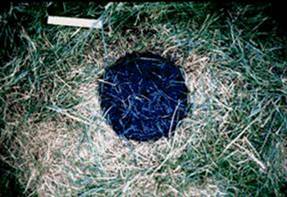
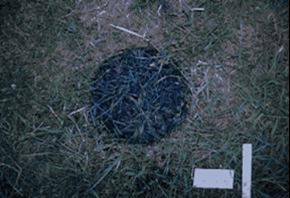
Figure 1. Brilliant blue dye was used to demarcate flow paths in the Hudson soil (silty clay loam) at an open area of the Cornell University Orchards. A 0.5-m infiltration ring was driven 1 cm deep into the soil. One per cent blue dye solution applied into the ring. The ring was removed after all dye infiltrated and backhoe excavation began. A deep pit was excavated next to the dyed area, and lateral hand excavation was used to expose undisturbed vertical soil profiles (please move the mouse over the image to see the preferential blue dye paths in various depths from the ground surface). A uniform dye distribution along the distribution layer/plow layer (about 10 cm), which is thinner than that in the Arkport soil, was observed. Below the distribution layer, the dye brached into many fine channels, following structural cracks and continuous earthworm channels, indicating the presence of significant preferential flow paths through macropores. Figure 2. Brilliant
blue dye was used to demarcate flow paths in the Arkport soil (sandy
loam) near the Cornell University. A 0.5-m infiltration ring was driven
1 cm deep into the soil. One per cent blue dye solution applied into
the ring. The ring was removed after all dye infiltrated and backhoe
excavation began. A deep pit was excavated next to the dyed area, and
lateral hand excavation was used to expose undisturbed vertical soil
profiles (please
move the mouse over the image to see the preferential
blue dye paths in various depths from the ground surface).
Blue dye path was more uniformly distributed than in the Hudson soil,
revealing a greater tendency towards matrix (convective-dispersive)
flow that in the Hudson soil.
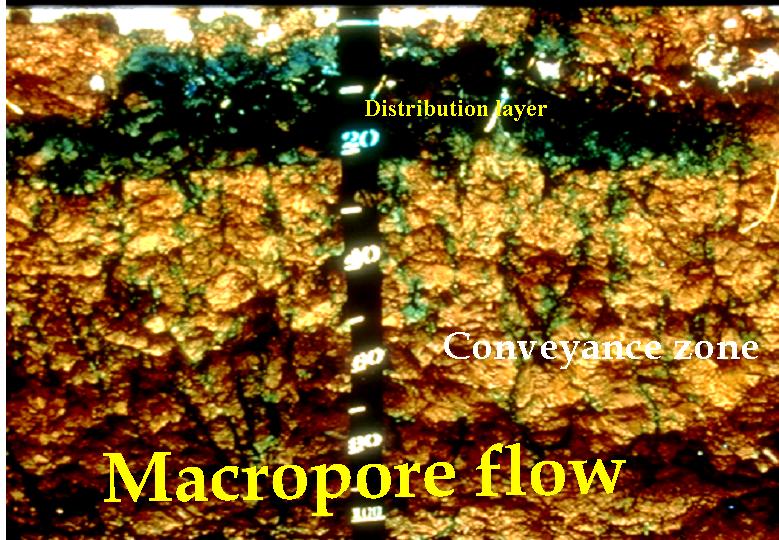
Figure 3. A uniform dye distribution along the distribution layer (plow layer). Below the distribution layer, the dye branched into many fine channels, following structural cracks and continuous earthworm channels (Source: Soil and Water Lab, Cornell University).
Figure 4. Examples of use of coloured vegetable dyes for revealing soil structure heterogeneity on chemical transport. Left : Vertical excavation revealing a plow layer of about 10 cm. Below the plow layer, the blue dye reveals preferential paths. Top : Using red and blue dyes applied at different times provides an indication of the diffusion rate from macropores to surrounding micropores. Bottom: Deep macropores about one meter below the soil surface. (Source: Soil and Water Lab, Cornell University).
|
||||||||||||||||||||||