| |
|
| |
|
|
|
|
| |
|
| |
|
|
|
|
| |
|
| |
|
|
|
 |
 |
|
CHARACTERISATION
OF SOIL STRUCTURE
Currently, one of the biggest hurdles in modelling and monitoring solute transport is an inability to properly characterise the macroporous structure of the soil. A knowledge of active transport zones in the soil matrix would provide a better understanding of the role and relative importance of macroporous channels in the transport process.
An alternative, inexpensive but also less effective method of characterising the soil matrix is to use coloured vegetable dyes. Various dyes can be added to the soil surface and allowed to infiltrate to lower portions of the soil horizon. Later, a vertical cross-section of the soil profile can be obtained by excavation. The problem with vegetable dyes is that they are organic and are rapidly absorbed into the soil matrix. An alternative to the use of vegetable dyes are stains and resins mixed with a florescent non-reactive dye. An example of the application of this technique is shown in the figure below. The figure shows a cross-section of a soil. Using computer enhancement techniques, the white areas indicate significant macroporous channels.
In a laboratory setting, the use of coloured vegetable or fluorescent dyes may also be helpful in identifying flow paths for chemical and moisture transport in undisturbed soil columns from the field. For example, at the completion of a flow experiment, the undisturbed soil core can be stained with various dyes and dismantled or serial-sectioned and photographed using high-resolution film or videography. When fluorescent dyes are used, the photographs are taken under UV light. These images can then be captured and processed using computer image-enhancement software. Once the images are digitised, software can then be used to identify and group pixels into macropores. These parameters can then be used to develop algorithms for determining equivalent hole diameters, porosity and circulatory indexes. Similar videographic and photographic methods have been developed to study moisture profiles in wetting-front instabilities for homogeneous and layered soils such as those found in: Yanuka & Elrick, 1985; Glass, et al., 1989; Glass, et al., 1989. Unfortunately, all of these techniques are destructive and can only provide static information at the end of an experiment. There is also the problem of scaling; data obtained from soil characterisation at a local scale may not adequately represent the heterogeneous nature of the soil profile on a field scale. These techniques appear to be useful only for laboratory-scale experiments.
References: Boll, J., Kung, K.-J. S., Ritter, W. F., Hendrickx, J. M. H., Herbert, S. J., Daliparthy, J., Tomer, M. D., & Steenhuis, T. S. (1993). Detection of textual interfaces using ground-penetrating radar. In H. J. M.-_. Seytoux (Ed.), Proceedings of the 13th American Geophysical Union Hydrology Days, Colorado, State University, Ford Collins, Colorado. 197 - 207. Glass, R. J., Steenhuis T. S., & Parlange, J.-Y. (1989). Mechanism for finger persistence in homogeneous unsaturated, porous media: Theory and verification. Soil Science, 148, 60 - 70. Glass, R. J., Steenhuis,
T. S., & Parlange, J.-Y. (1989). Wetting front instability,
2. Experimental determination of relationships between systems parameters
and two-dimensional unstable flow field behaviour in initially dry
porous media. Water Resource Research, 25, 1195 - 1207. Peyton, R. L., Gantzer, C. J., Anderson, S. H., Haeffner, B. A., & Pfeifer, P. (1994). Fractal dimension to describe soil macropore structure using X-ray computed tomography. Water Resources Research, 30(3), 691 - 700. Ringrose-Voase, A. J. (1987). A scheme for the quantitative description of soil macrostructure by image analysis. Journal of Soil Science, 38, 343 - 356. Yanuka, M., & Elrick, D. E. (1985). Applications of microcomputer-based image digitization in soil and crop sciences. Computers and Electronics in Agriculture, 1, 59 - 73. |
||||||||||||||||||||||

 Recently,
X-ray Computer-Assisted Tomography (CT-scans) has been used to characterise
large biopores in unexposed interior portions of undisturbed soil
samples (e.g., Ringrose-Voase, 1987; Peyton, Wigger J. W., &
Gantzer, 1992; Peyton, et al.,1994). The figure on the left (repoduced
from Peyton, et. al., 1994) shows a magnified section of soil with
clearly marked macropores using this technology. The
method is able to non-destructively measure macropore-scale density
in undisturbed soil cores and visualise three-dimensional flow patterns
for solutes. Hole porosity and equivalent hole perimeters and diameters
to a resolution of 0.5 mm can also be identified by this method.
Whilst the CT-Scanning technique is an excellent non - destructive
sampling methodology, it is very expensive and not readily available
to most scientists.
Recently,
X-ray Computer-Assisted Tomography (CT-scans) has been used to characterise
large biopores in unexposed interior portions of undisturbed soil
samples (e.g., Ringrose-Voase, 1987; Peyton, Wigger J. W., &
Gantzer, 1992; Peyton, et al.,1994). The figure on the left (repoduced
from Peyton, et. al., 1994) shows a magnified section of soil with
clearly marked macropores using this technology. The
method is able to non-destructively measure macropore-scale density
in undisturbed soil cores and visualise three-dimensional flow patterns
for solutes. Hole porosity and equivalent hole perimeters and diameters
to a resolution of 0.5 mm can also be identified by this method.
Whilst the CT-Scanning technique is an excellent non - destructive
sampling methodology, it is very expensive and not readily available
to most scientists. 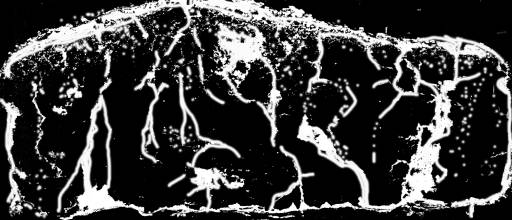
 On
large field scale experiments such methods may not very useful.
The use of Ground-Penetrating Radar (GPR) as a non-destructive soil-characterisation
method has been proposed. GPR can be used to detect water table
elevation, subsurface textural discontinuities, subsurface structures,
wastes and waste migration. The technique has been largely used
in drainage and construction engineering. The technique operates
much like sonar and reflection seismology. A short pulse of high
frequency electromagnetic energy is transmitted into the ground.
Changes in electrical properties of the soil, which is primarily
controlled by textural characteristics (e.g., clay and moisture
content) cause part of the transmitted signal to be reflected. The
reflected signal is detected by a receiver and after amplification,
the amplitudes of the two-way travel time are stored in computer
files for further analysis (see Boll, et al., 1993 for further details).
The figure on the left above (reproduced from Boll, et. al, 1993)
is an example of the use of GPR for improving the siting of subsurface
sampling devices. The investigation site was the University of Delaware's
Research and Education Center near Georgetown, DE. The field site
consisted of a loamy sand. This figure shows a 5 m section. The
upper 60 cm shows reflection off the surface and plow layer, after
which a small zone of homogeneous material follows to a depth of
1 to 1.2 m. Below 1.2 m, stratification is clearly visible showing
inclined layers. The depth of penetration in this case was 3 m and
the depth of the water table was located at 2.5 m. GPR is a useful
but difficult technique. It is also moderately expensive. The penetration
depth of the radar wave depends on the antenna frequency and consequently
the resolution of the image. Greater penetration depths usually
mean lower sampling resolution. The penetration depth also depends
on soil properties. It is greatest for dry sandy soils.
On
large field scale experiments such methods may not very useful.
The use of Ground-Penetrating Radar (GPR) as a non-destructive soil-characterisation
method has been proposed. GPR can be used to detect water table
elevation, subsurface textural discontinuities, subsurface structures,
wastes and waste migration. The technique has been largely used
in drainage and construction engineering. The technique operates
much like sonar and reflection seismology. A short pulse of high
frequency electromagnetic energy is transmitted into the ground.
Changes in electrical properties of the soil, which is primarily
controlled by textural characteristics (e.g., clay and moisture
content) cause part of the transmitted signal to be reflected. The
reflected signal is detected by a receiver and after amplification,
the amplitudes of the two-way travel time are stored in computer
files for further analysis (see Boll, et al., 1993 for further details).
The figure on the left above (reproduced from Boll, et. al, 1993)
is an example of the use of GPR for improving the siting of subsurface
sampling devices. The investigation site was the University of Delaware's
Research and Education Center near Georgetown, DE. The field site
consisted of a loamy sand. This figure shows a 5 m section. The
upper 60 cm shows reflection off the surface and plow layer, after
which a small zone of homogeneous material follows to a depth of
1 to 1.2 m. Below 1.2 m, stratification is clearly visible showing
inclined layers. The depth of penetration in this case was 3 m and
the depth of the water table was located at 2.5 m. GPR is a useful
but difficult technique. It is also moderately expensive. The penetration
depth of the radar wave depends on the antenna frequency and consequently
the resolution of the image. Greater penetration depths usually
mean lower sampling resolution. The penetration depth also depends
on soil properties. It is greatest for dry sandy soils.